Stop Wrangling Sales Data
Start modeling the revenue org
Colby Schrauth
Founder, DimTable
The problem nobody owns
Everyone has the same data, scattered the same way
The org chart lives in the HRIS. Quotas live in a spreadsheet the comp team guards. Territories live in the CRM — and in three people’s heads. Ramp expectations live nowhere; they’re a vibe. Forecast lives in yet another spreadsheet, and actuals live in the warehouse, if you’re lucky.
None of it joins. So every quarter someone rebuilds the same brittle workbook to answer questions that should be trivial: Are we covered on quota? Which reps are behind their ramp? What did the West team actually commit — and is the pipeline behind that number real?
The reason this is painful isn’t that the questions are hard. It’s that the data was never modeled.
A sales org isn’t a pile of spreadsheets. It’s a dimensional model waiting to be written down.
The reframe
A revenue org is a dimensional model
Strip away the tools and a sales organization has a beautiful, almost textbook shape: a handful of dimensions — the nouns of your business — surrounding a small set of facts that measure what actually happened.
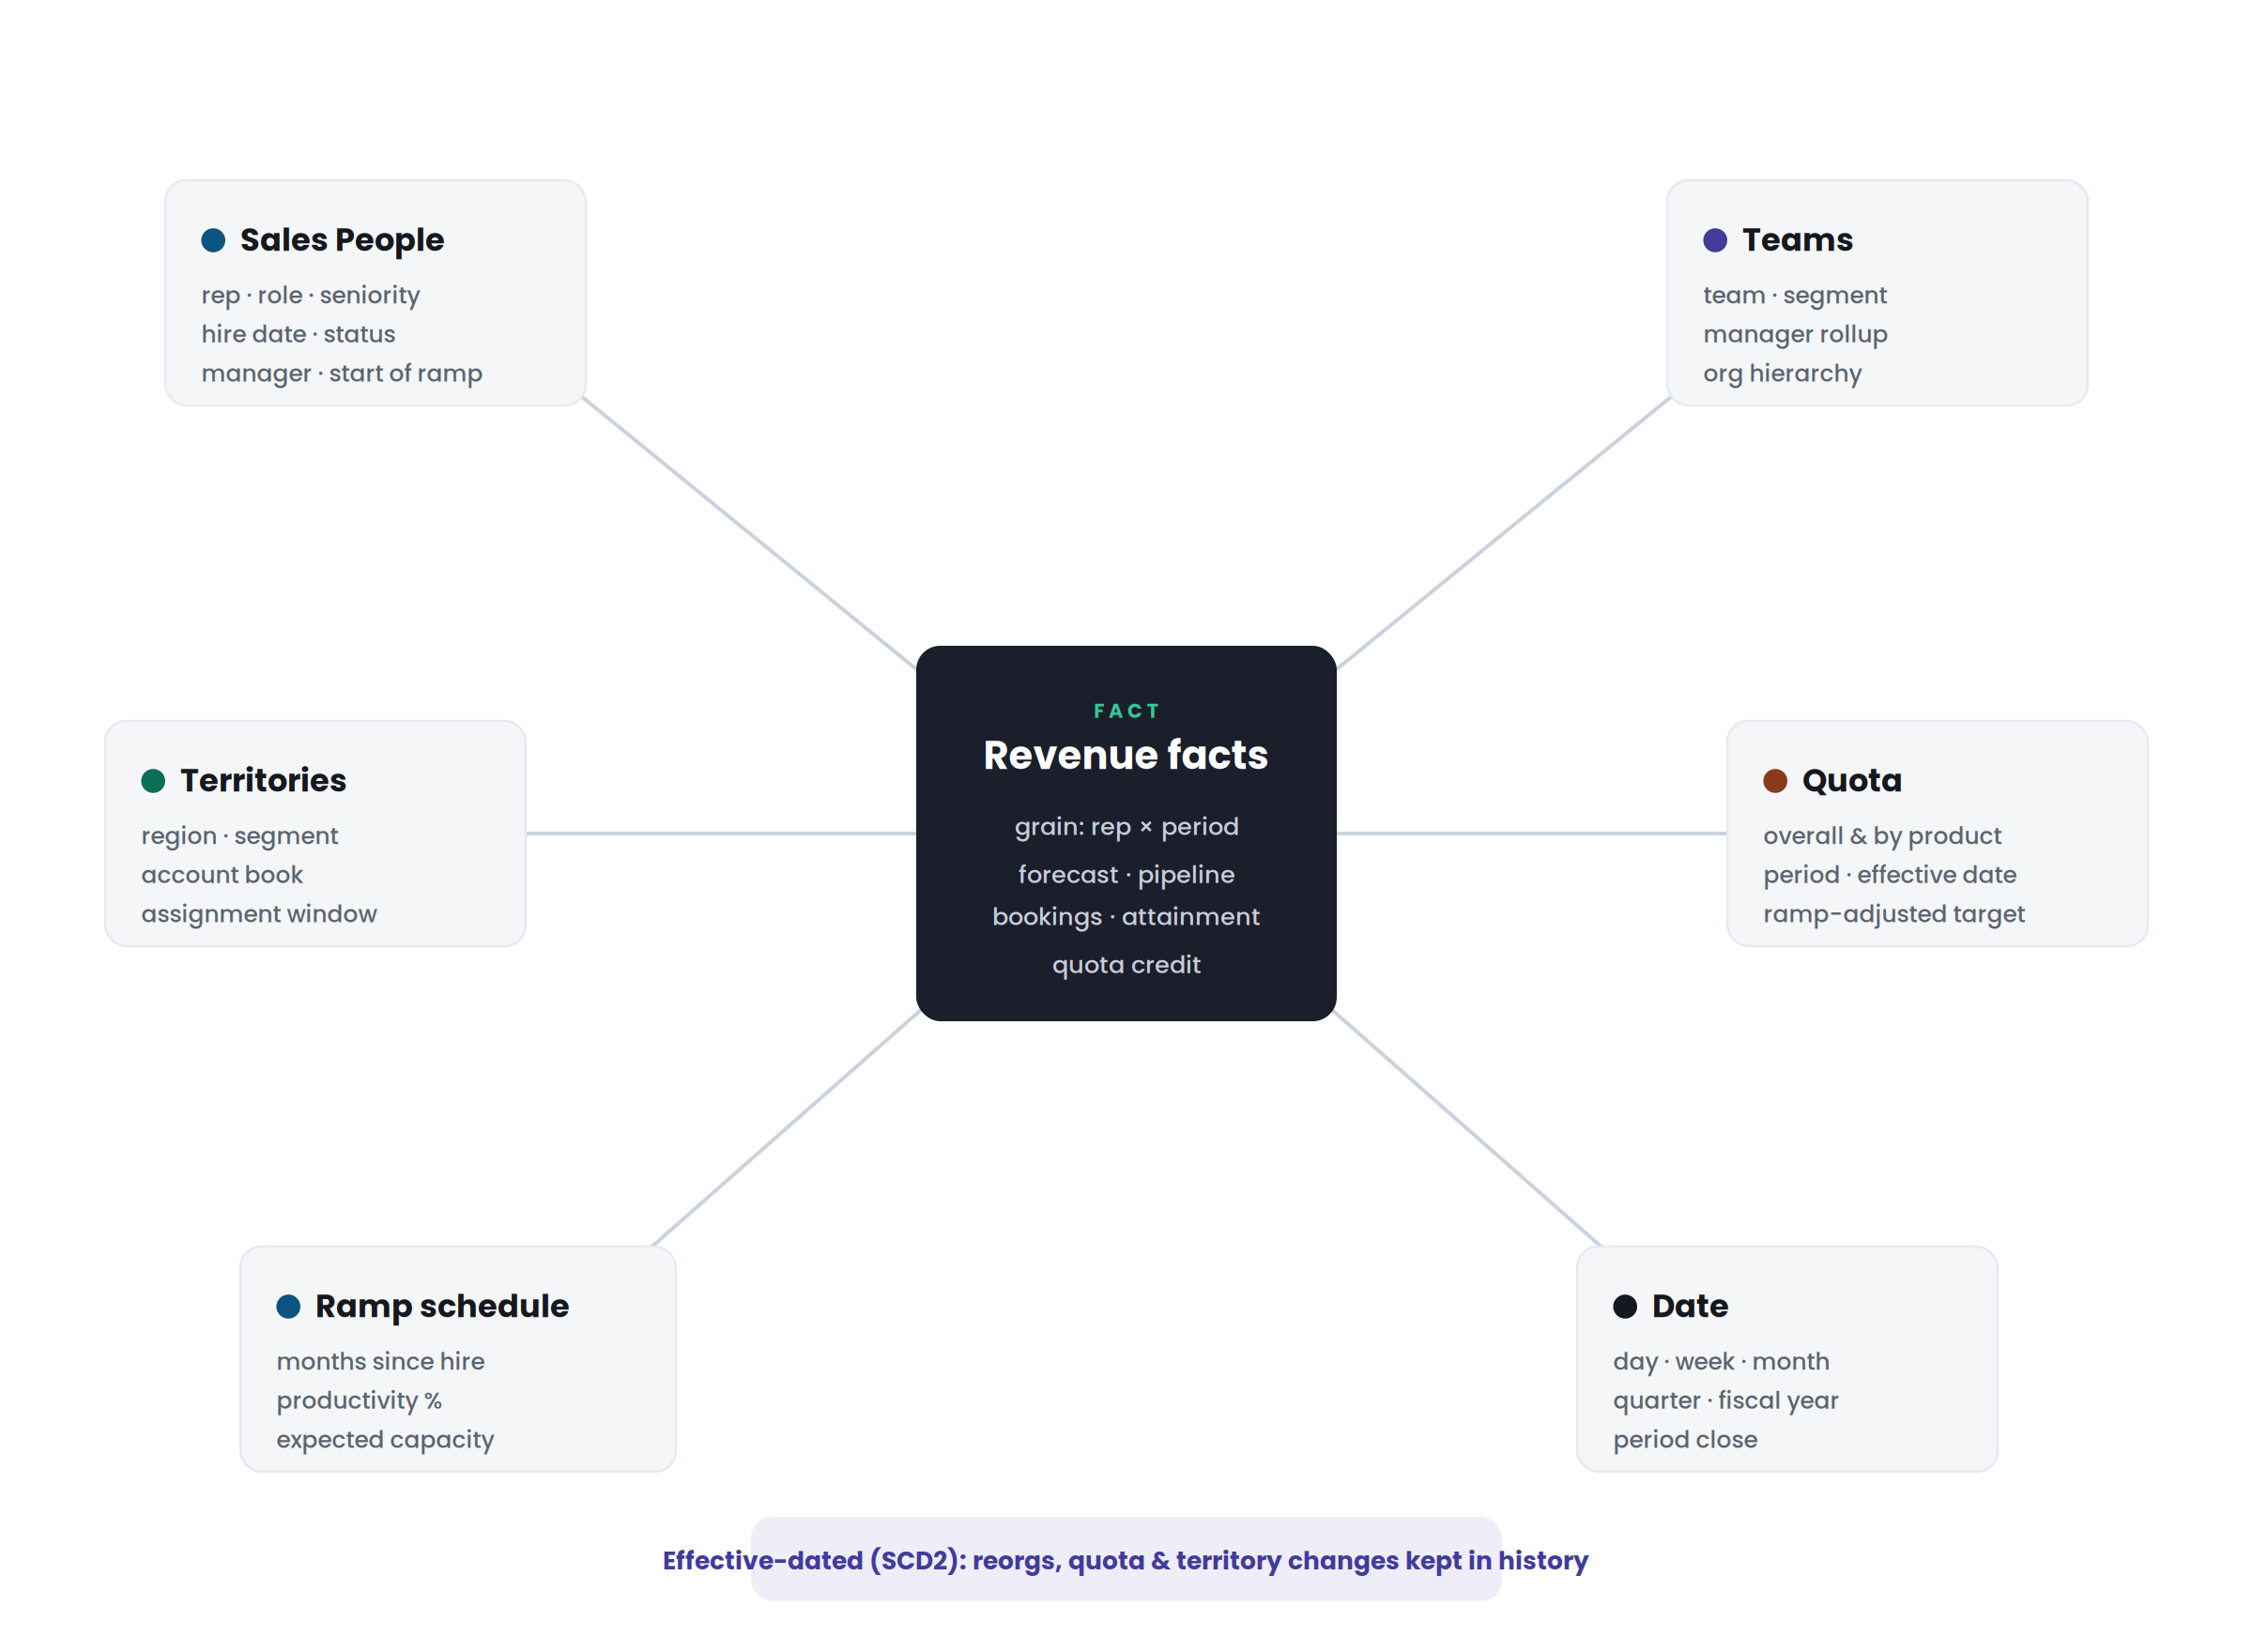
Dimensions are the stable things you slice by: people, teams, territories, quotas, ramp schedules, dates. Facts are the events you measure: what was forecast, what’s in pipeline, what closed. Get the dimensions right and every question — by rep, by team, by product, by period — becomes a join, not a project.
The building blocks
The seven things every sales org has
- Sales People — your reps, managers, and leaders, each with a hire date, role, and reporting line that changes over time.
- Teams — the org chart of the revenue organization: pods, segments, regions, and the management hierarchy above them.
- Territories — the named slices of the market each rep or team owns, whether defined by geography, vertical, account size, or named accounts.
- Quotas — the number every rep carries, broken out by period, product, and type (new business, expansion, renewal), with effective dates so mid-quarter changes don’t rewrite history.
- Ramp schedules — the curve that says a new hire carries 0% of quota in month one, 50% in month two, and 100% by month four (or whatever your org defines).
- Forecast — the weekly or monthly call: commit, best-case, and pipeline by rep, rolled up by team and product.
- Actuals vs. pipeline — what actually closed and what’s still open, joined to the rep, team, territory, and quota that were in effect when the deal moved.
The idea that makes all of this trustworthy is effective dating. When a rep changes territory, gets promoted, or a quota resets mid-year, we don’t overwrite the old value — we close it and open a new one. Ask “what was true in Q2?” and the model answers with the Q2 org chart, not today’s.
Where it starts
It starts the moment someone is hired
Most sales-data work starts late — a rep shows up in reporting weeks after their start date, once someone remembers to add them. We start at hire. The instant a new rep is created in your HRIS, they exist in the model: placed on a team, ready for a territory and quota, ramp clock already running.
No more “who’s this rep, and why isn’t their number showing up?” The org chart is always current, because it’s the same one your People team already maintains.
End to end
Hire to forecast, in three moves
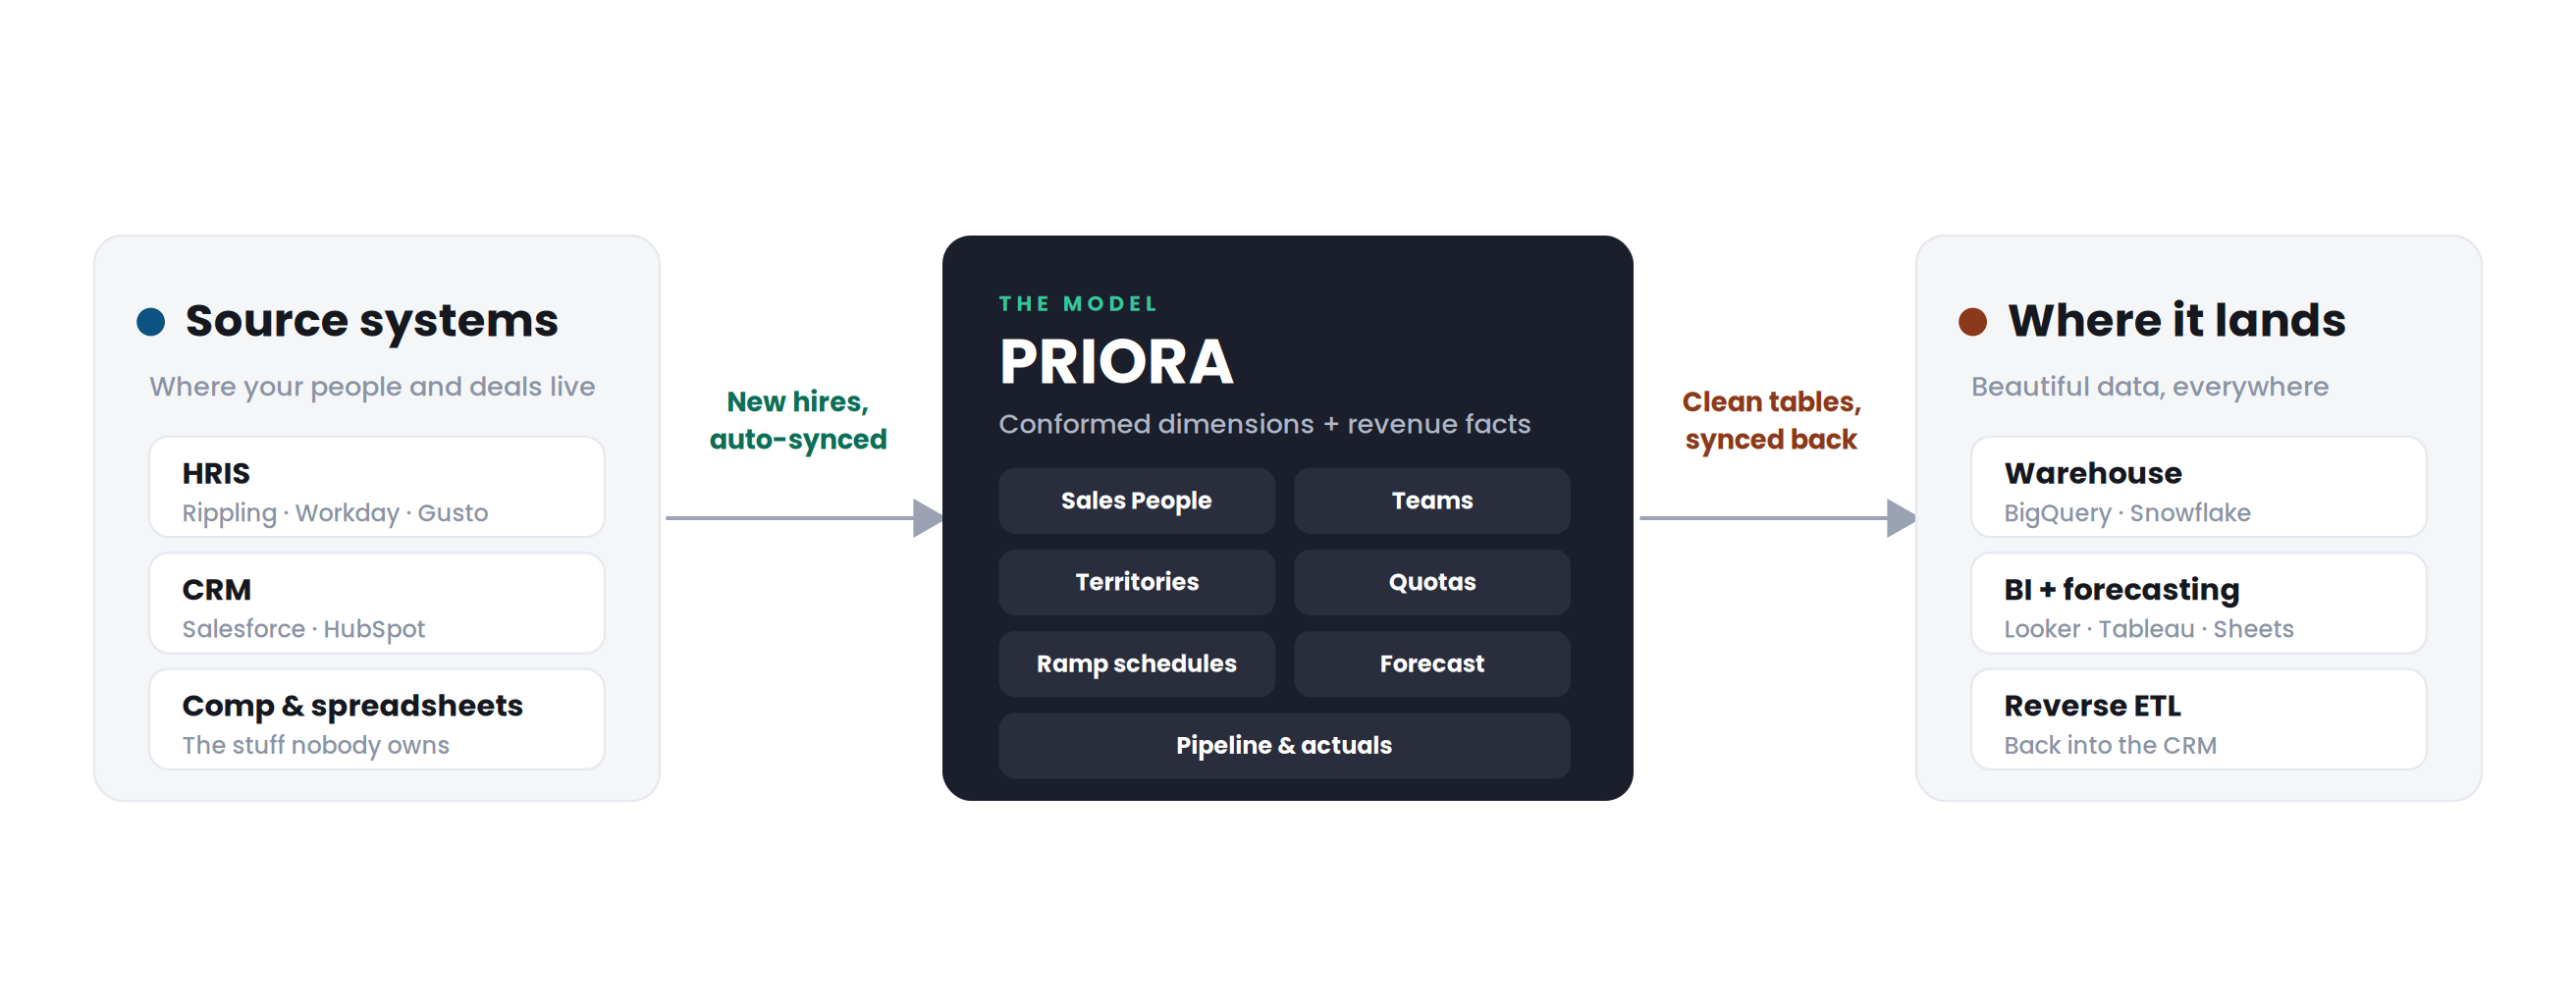
- Ingest — new hires from the HRIS, deals and pipeline from the CRM, and the quota and comp context that usually hides in spreadsheets.
- Model — conformed dimensions and revenue facts, effective-dated, with ramp-adjusted quota baked in.
- Sync back — the clean, modeled tables land in your warehouse so BI and forecasting just work.
Your data team stops being a spreadsheet janitor and starts getting beautiful, conformed tables they can actually build on.
The payoff
What you can finally answer
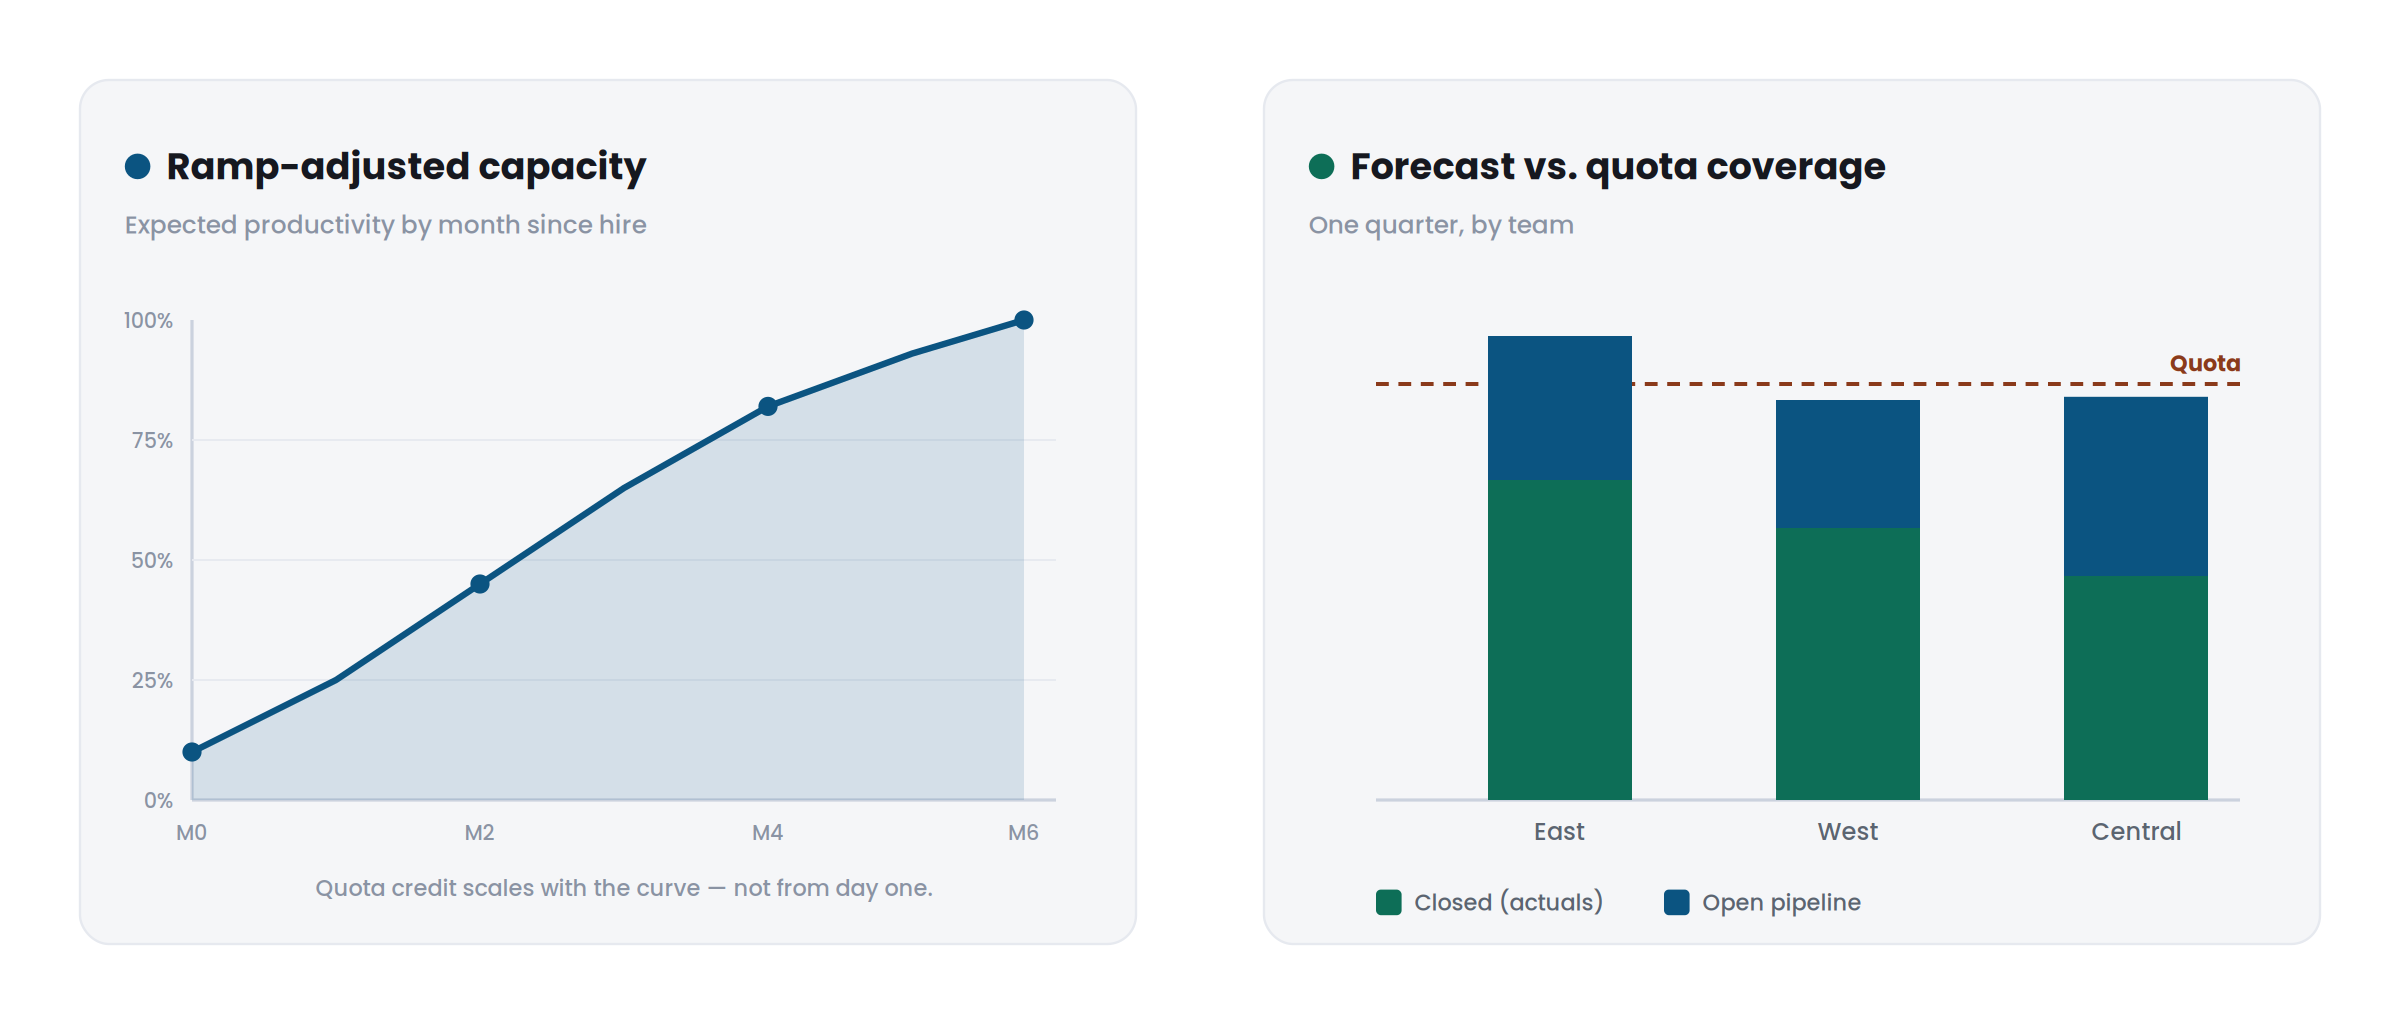
- Ramp-adjusted coverage — quota credit scales with the ramp curve, so a team of new hires isn’t judged like a team of veterans.
- A forecast you can defend — commit and best-case sit next to actuals and open pipeline, with coverage ratios by team and product.
- History that holds up — because everything is effective-dated, you can rerun any past quarter exactly as it was.
- Instant onboarding — a rep hired today is in the model today.
For the data team
Beautiful data, by default
The same model that gives revenue leaders a forecast they trust gives data teams something rarer: clean, documented, conformed tables in the warehouse — not a tangle of CRM exports and quota spreadsheets to reverse-engineer every quarter. Definitions live in one place. The numbers match across every dashboard, because they all come from the same source.